Beta test
Statistical sessions map · Index futures

Know the day's battlefield
right after the session open.

SessionsEDGE gives index-futures traders a statistical map of the session — how much room the day has, and the probabilities of price reaching the levels that matter. We don't predict direction. We show you the levels and odds.

Live all session
MNQ / MES futures
More assets soon
Cancel anytime

Not another signal service

Intraday direction is statistically close to a coin flip — we won't pretend otherwise. But how far a session travels and the levels price reacts to are far more predictable. On top of that we give you ranges, timing, gaps and the odds of price reaching each level across every horizon — so you can plan trades on statistics, not emotion. It's up to you to combine this map with your own entry and exit models.

Multi-timeframe ranges

Manipulation and distribution reads on weekly, daily and intraday timeframes — 4H, 2H and 1H blocks — so every horizon you trade has its own map.

Expected range

Plan your trades around these levels — size targets and stops to how much room the session actually has, not yesterday's.

Probability engine Beta

Reachability ladders show how often price goes on to hit each level within a given time horizon — how far the day can reach, not which way it's headed.

Percentile & timing

How big this session is against its own history, when the session's high and low tend to print, and how the overnight gap sizes up against expected travel.

Opening range

Opening-range statistics across the 9:30–9:45, 9:30–10:00 and 9:30–10:30 windows — broken down by weekday, so you know the range this open tends to build.

GEX levels Beta

Gamma-exposure levels layered onto the session map — the newest module, in active development.

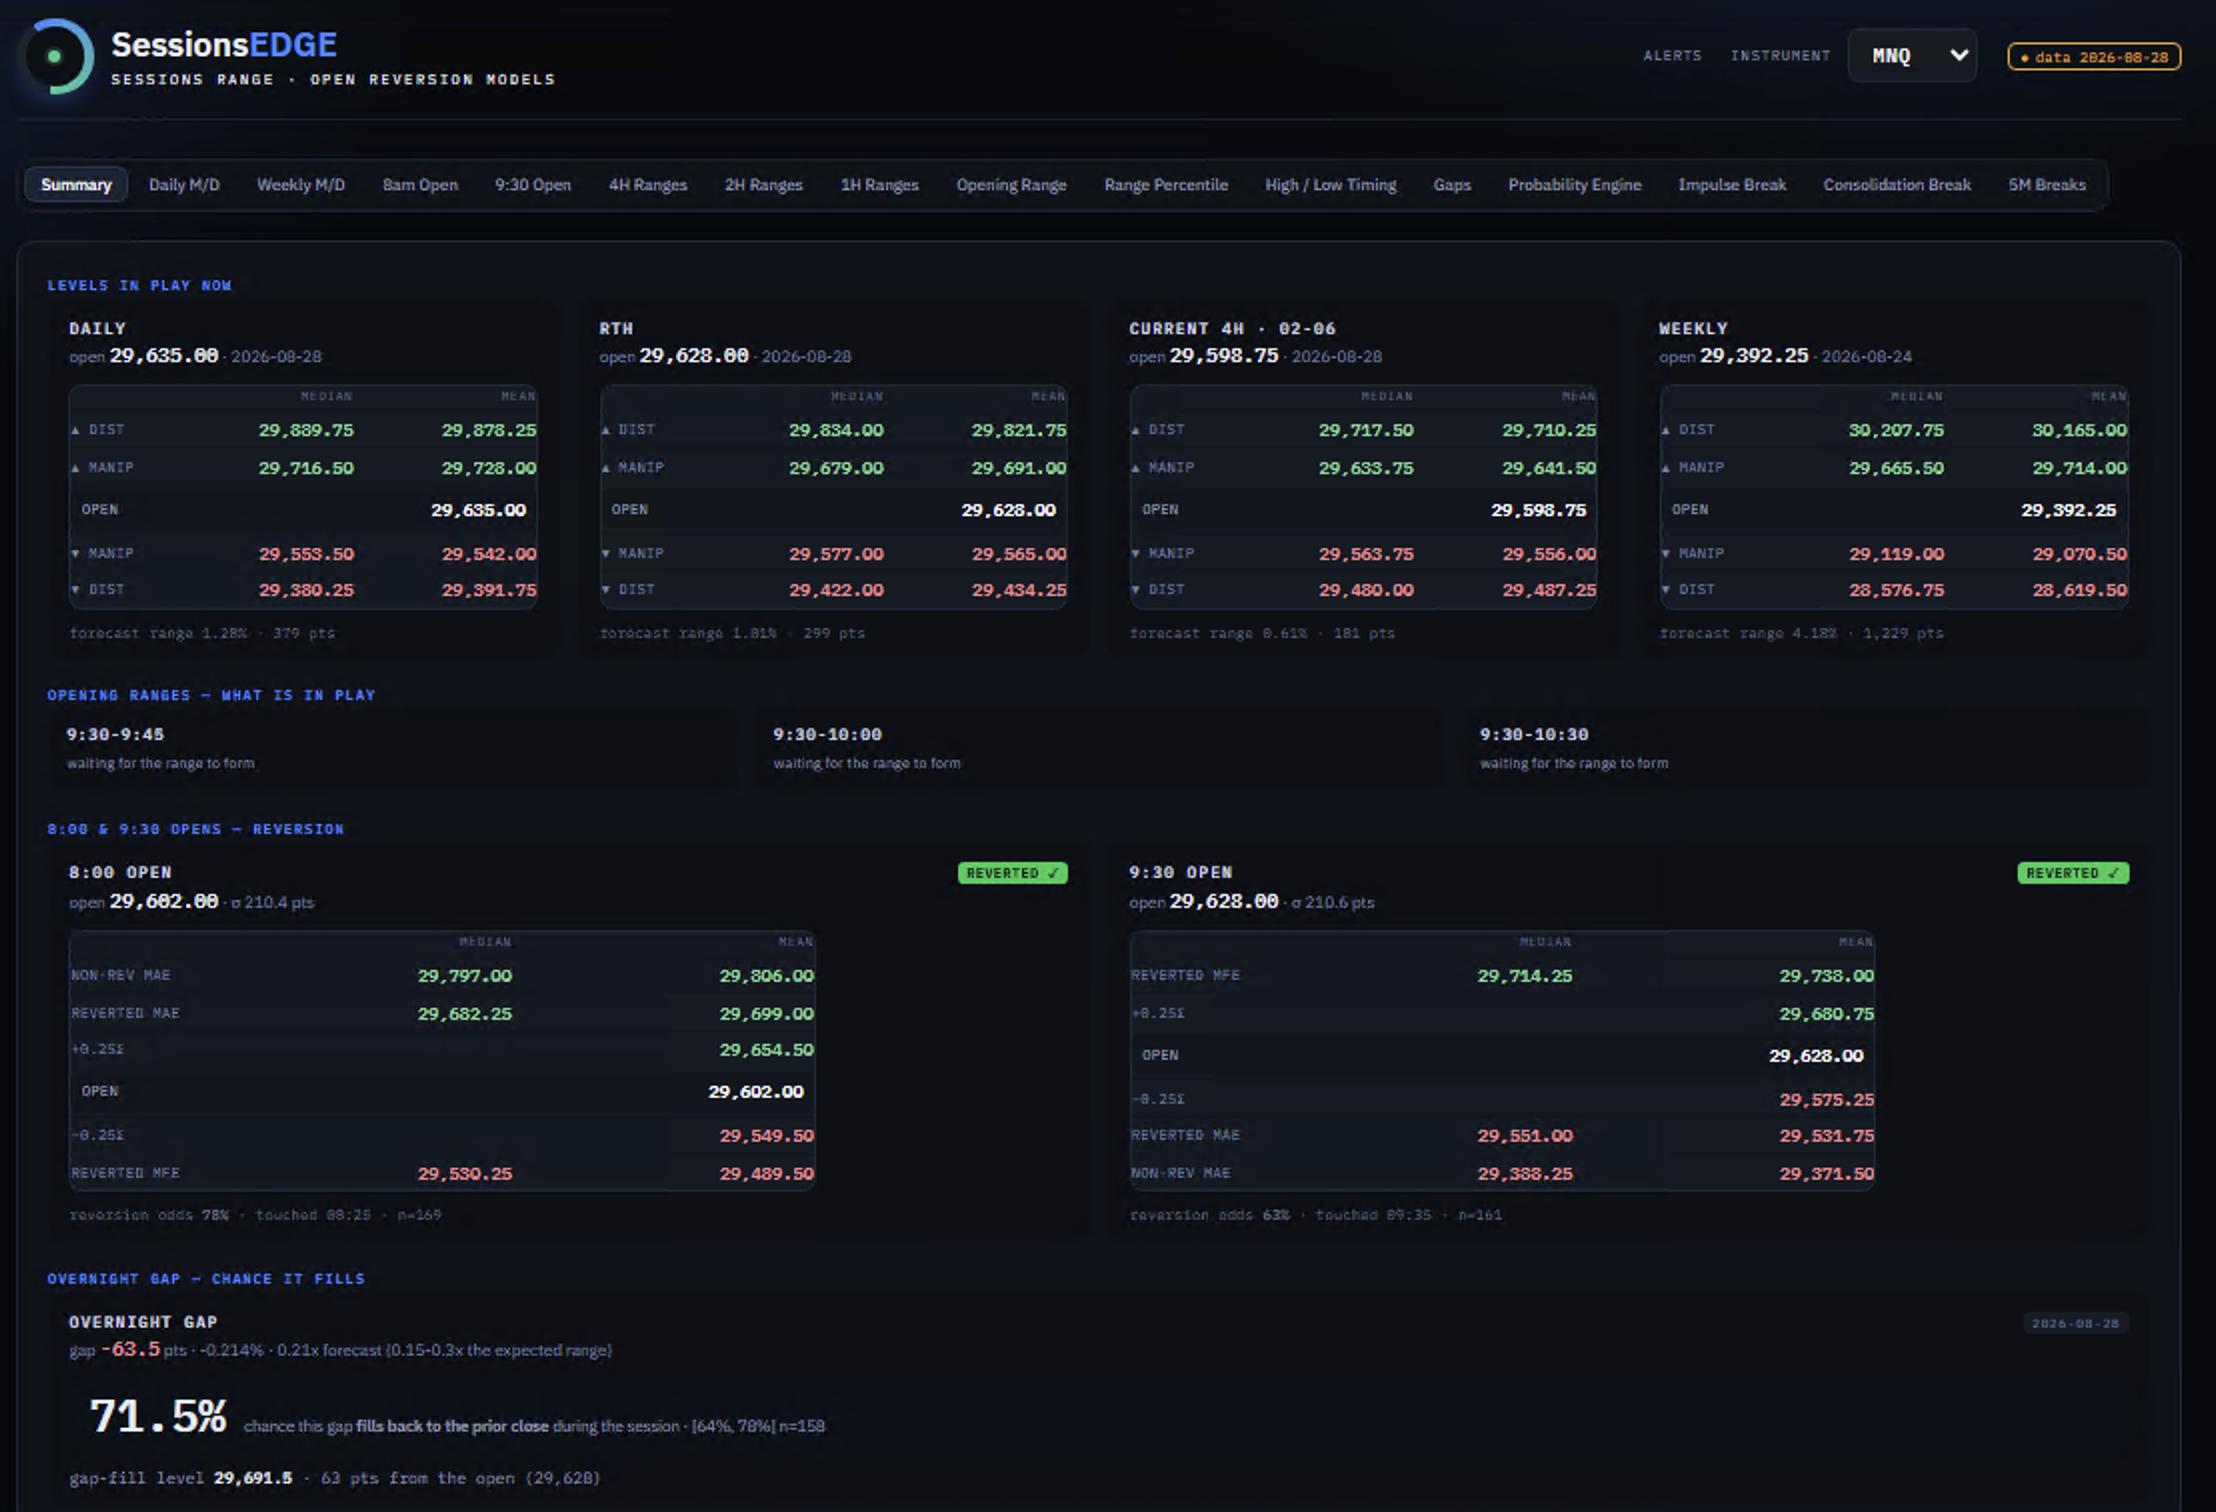
Summary Daily M/D Weekly M/D 8am Open 9:30 Open 4H Ranges 2H Ranges 1H Ranges Opening Range Range Percentile High / Low Timing Gaps GEX Levels · beta Probability Engine · beta

How it works

Market context, computed continuously, provided for every session.

Subscribe

Create an account and start your trial. Cancel anytime.

Free beta test

Open the dashboard

A Summary view distills the key numbers at a glance, with detail tabs — ranges from 1H to weekly, open levels, timing, gaps and probability ladders — for the full picture, refreshing through the session.

Trade your plan

As an example, combine the daily map with the 9:30am open for added context, then layer in your own entry model to trade it. It's a map, not a prediction.

NinjaTrader indicator

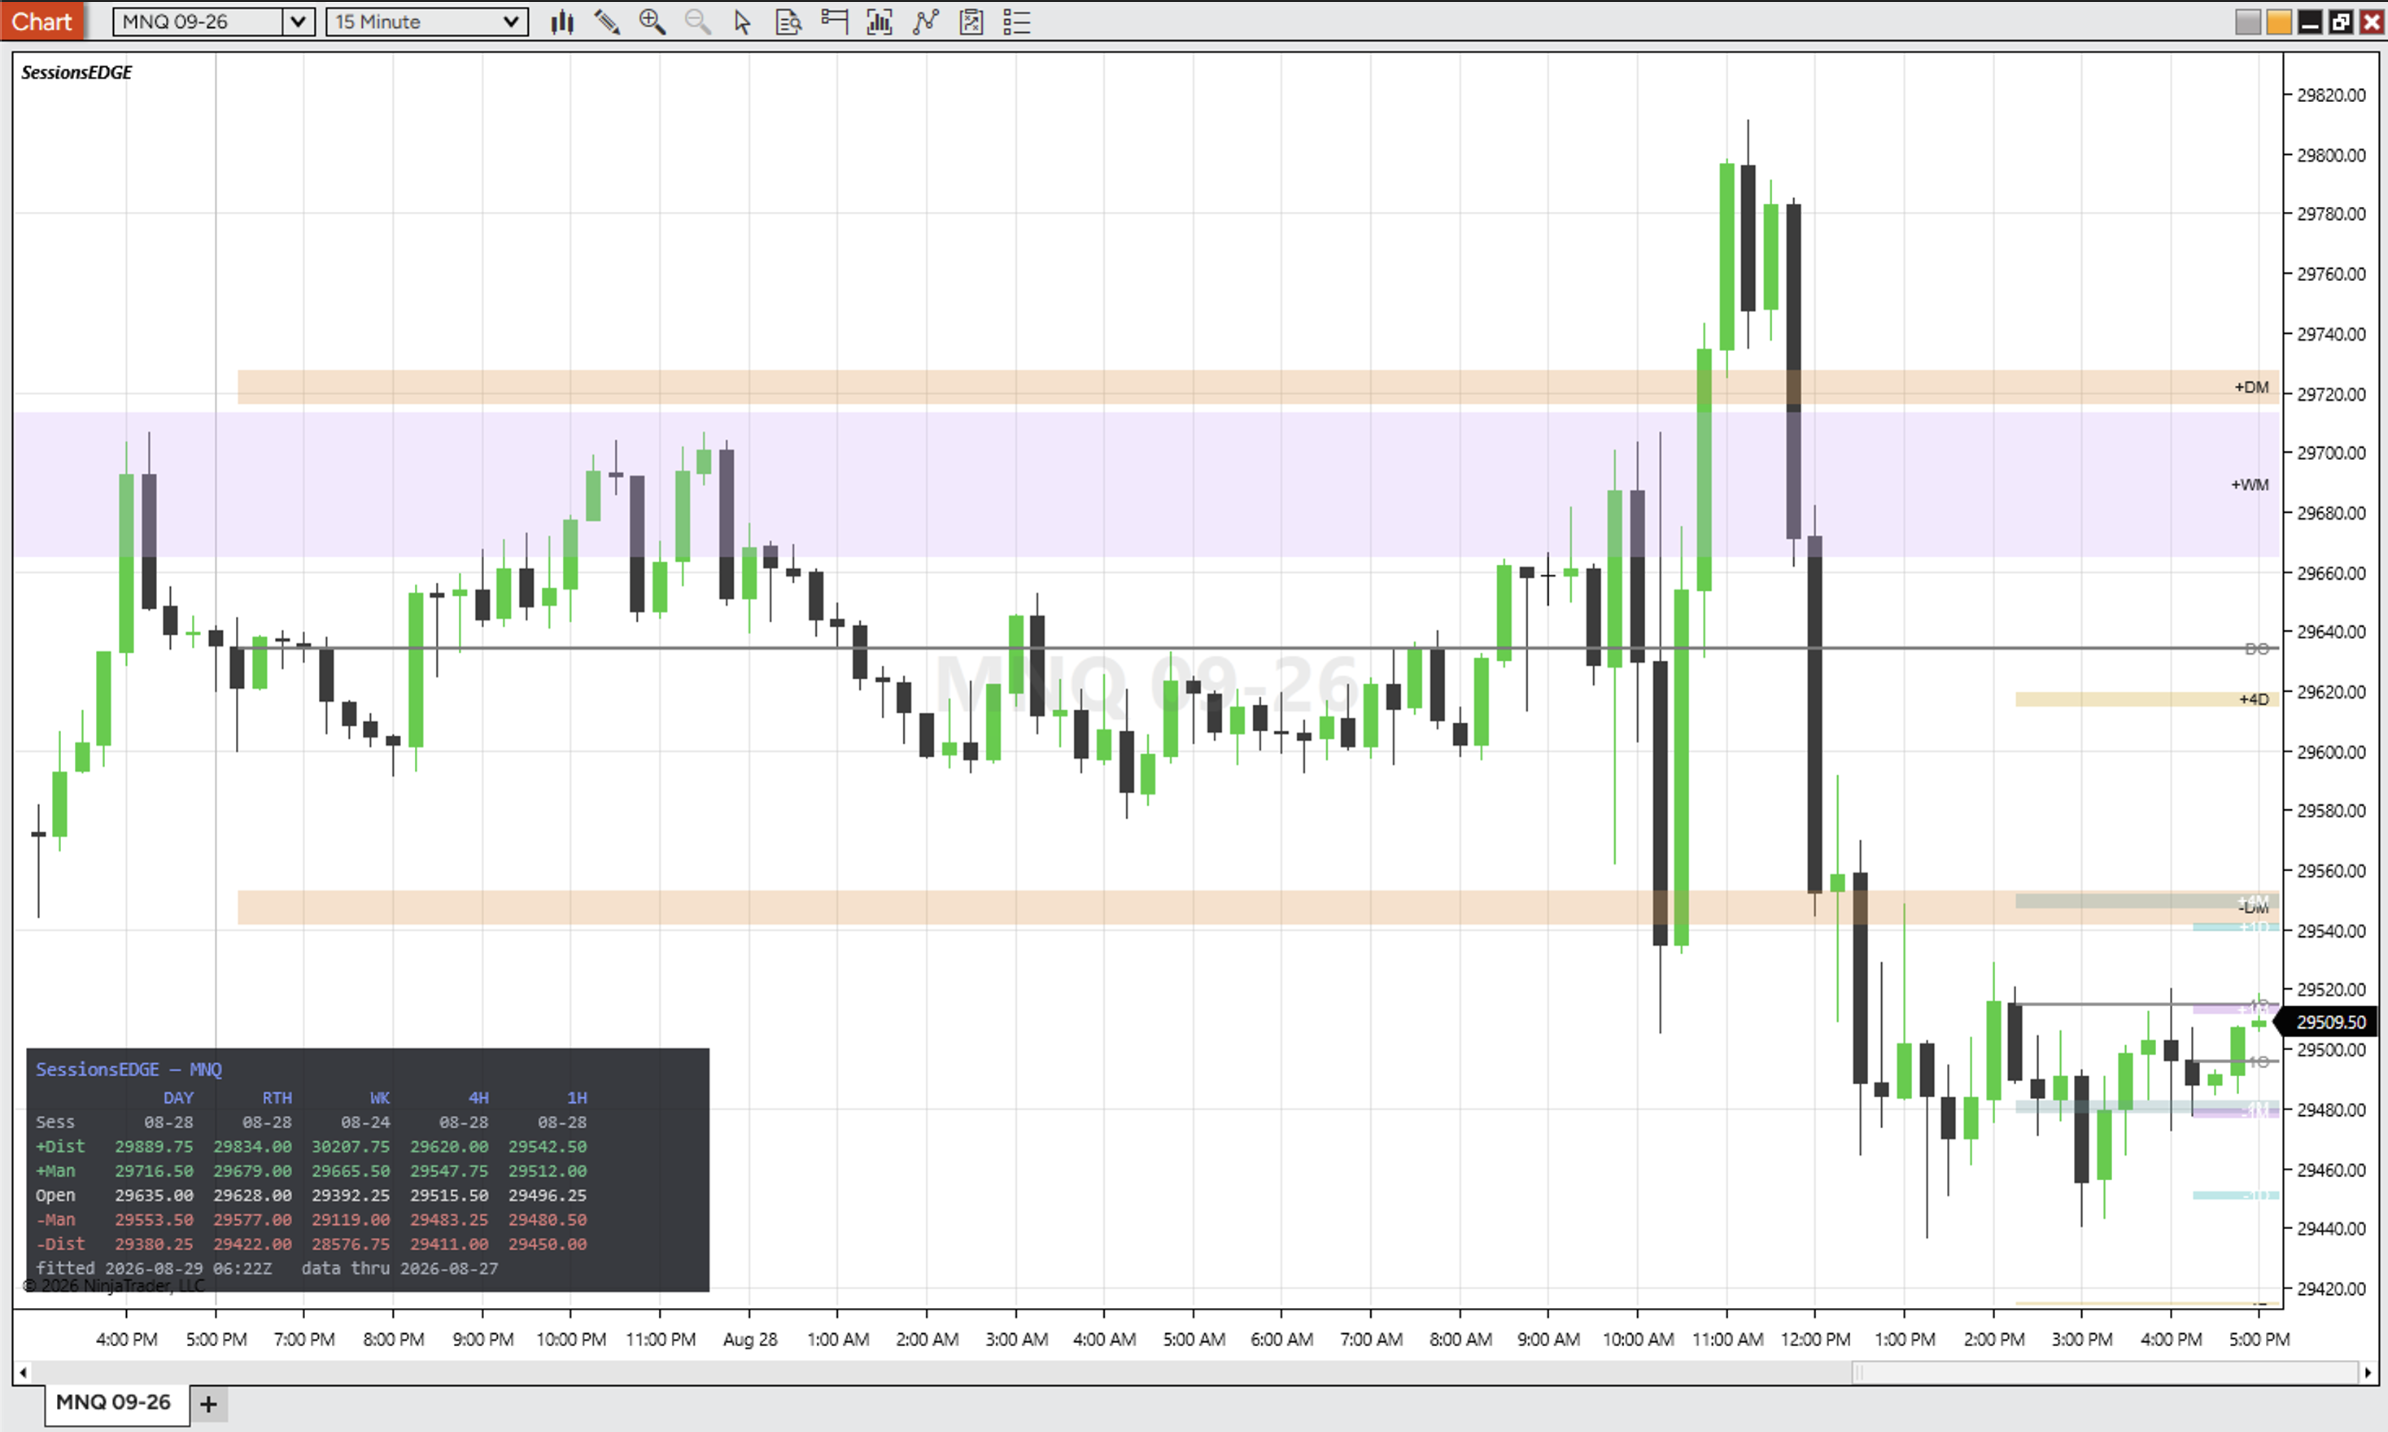
An indicator for NinjaTrader 8 that brings the key SessionsEDGE levels and info straight onto your chart.

In development
Free for everyone for a limited time only — the full live dashboard, no signup.
Launch the live demo dashboard →
Opens the real SessionsEDGE dashboard, framed and ready. No account needed this week.

Simple pricing

One plan. Everything included. Cancel anytime — no lock-in.

Full access
$29.95/month
  • Live session dashboard — all modules
  • Multi-timeframe ranges — 1H / 2H / 4H, daily & weekly
  • Session-open reaction levels
  • Probability engine & range percentile
  • High/low timing, gaps & opening range
  • Community access & the daily map
Start 7-day trial for $7
Then $29.95/month. Cancel at any time.

Coming soon

Questions

Does it tell me to buy or sell?

No — and that's the point. Intraday direction is close to a coin flip. SessionsEDGE shows you the day's range and the levels price reacts to, so you can frame and trade your own plan around the information provided.

What instruments does it cover?

MNQ and MES (Micro E-mini Nasdaq-100 and S&P 500) at launch. More instruments later.

What timeframes does it cover?

From 1-hour, 2-hour and 4-hour blocks up to daily and weekly maps — plus dedicated 8am and 9:30am RTH open views, so every horizon you trade has its own read.

What is the probability engine?

It shows level reachability, not direction: how often price goes on to reach each level within the current time window, versus its long-run baseline. It tells you whether and how far price can reach — never which way it's headed.

Where do the numbers come from?

Our own internal research on index futures, validated using backtests and walk-forward tests, and regularly recalibrated. The methodology stays in-house.

Can I cancel?

Anytime, from your account. No lock-in, no contracts.